Operations Introduction
This section provides guidance on understanding the Defakto Security Platform from an operations, monitoring, and troubleshooting perspective.
Reference Architecture
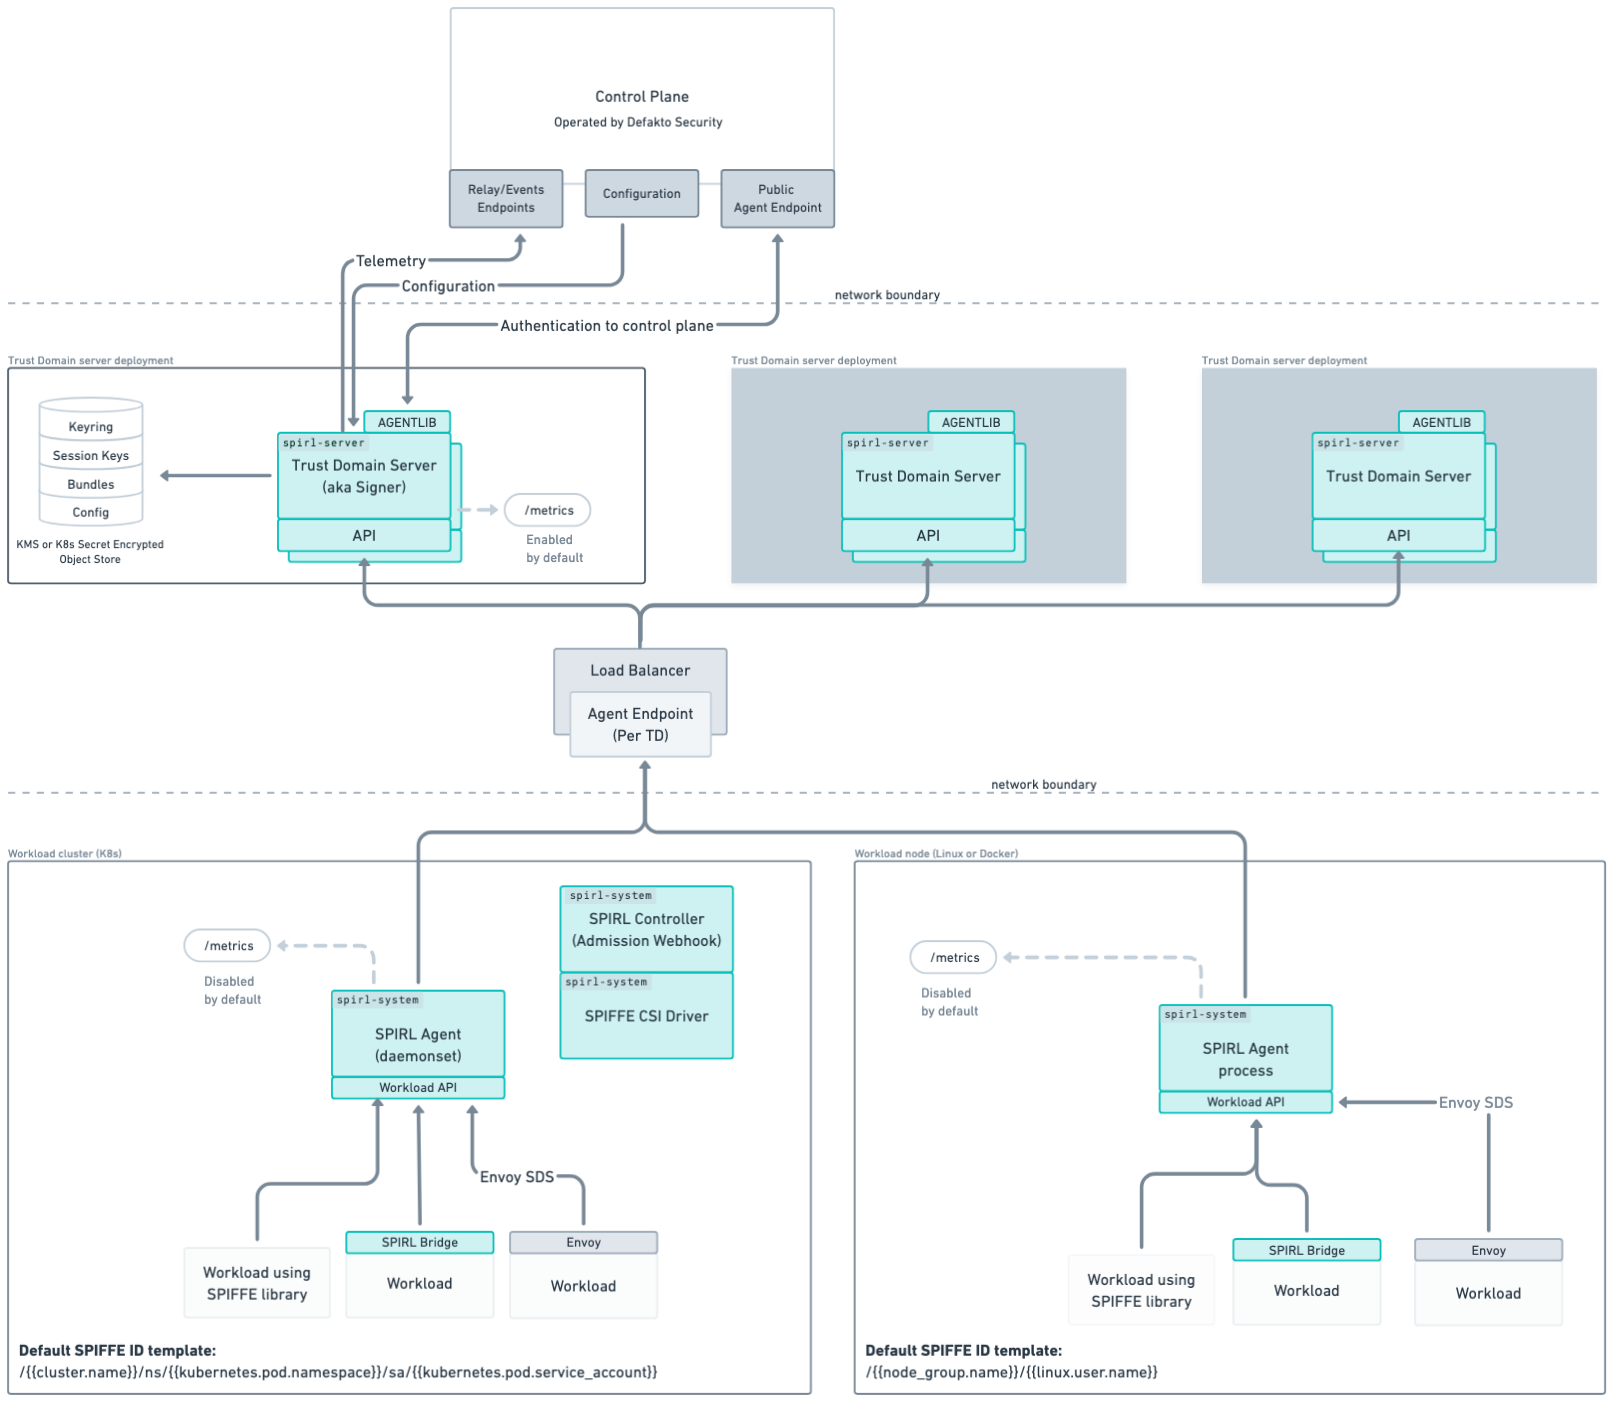
There are two primary software installations that enable the Defakto Security workload identity platform:
- Trust Domain Servers - Issue workload identity credentials and are installed as clusters of instances on Kubernetes called a
Trust Domain Deployment. A Trust Domain comprises one or moreTrust Domain Deploymentinstallations. - Agents - Software components that run alongside workloads, providing an API for credential retrieval, collecting
attestationmetadata, and communicating withTrust Domain Serversto obtain credentials.
There are also several supporting processes that may be included depending on the runtime or specific customer setup:
- spirl-controller - Included with the agent installation when running on Kubernetes. Provides webhook integrations with Kubernetes to enable workload configuration using labels.
- spirl-sync - Synchronizes non-Defakto system trust stores with a Trust Domain's trust store.
- spiffe-csi-driver - Enables workload pods to connect to an agent using a CSI mount within Kubernetes.
A variety of infrastructure exists to support the retrieval of Workload Identity Credentials:
- Control Plane - A service operated by Defakto Security that provides a dashboard, configuration management, and coordination of multiple trust domains.
- Load Balancers - Network infrastructure positioned between Agents and Servers and frequently used to provide regional failover. These components are specific to individual customer installations.
Monitoring Overview
The Defakto Security platform is designed to integrate with customers' preferred off-the-shelf monitoring tools focused on logging and metrics:
- Logs - Each process emits JSON-encoded logs to make it easy for logging tools to parse log fields into semi-structured logs. Logs may be subject to change between releases.
- Metrics - The primary Server and Agent processes can be configured to have Prometheus-compatible
/metricsendpoints. This works with a variety of metrics and monitoring tools that can support prometheus compatible metrics scraping.
Metrics Collection Guides
To gain a complete understanding of Defakto Platform status, we recommend collecting metrics from a variety of layers:
- Kubernetes Platform Monitoring - Monitor pod health, resource utilization, node status, and cluster state using kube-state-metrics, metrics-server, and cAdvisor
- Server Metrics - Application-specific metrics for Trust Domain Servers including SVID operations, attestations, gRPC performance, resource management, and HPA configuration
- Agent Metrics - Application-specific metrics for SPIRL Agents including workload identity delivery, control plane connectivity, and cache performance
Additional Resources
- Metrics Reference - Complete list of available metrics
- Dashboard Templates - Pre-built Grafana dashboards
- Telemetry Configuration - Enabling and configuring metrics collection